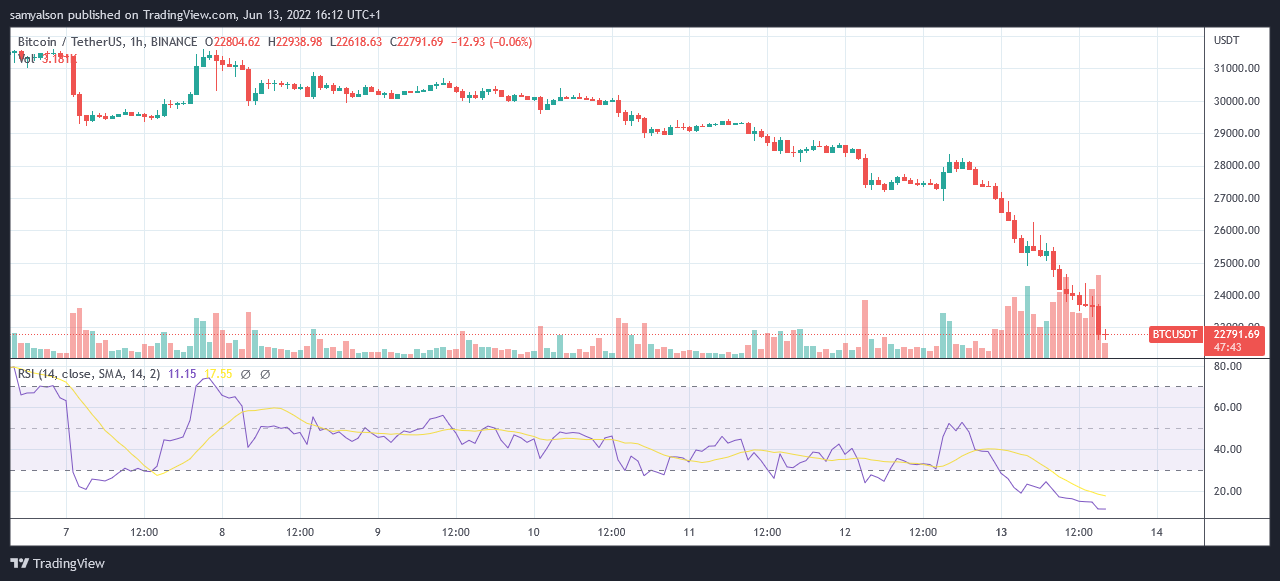
Bitcoin (BTC) sees a 16% drop in value on Monday, taking the market leader below $23,000 for the first time since December 2020.
Although bulls successfully defended $25,000 in the early hours of Monday, a continuation of sell pressure led to a break of that price level at around 08:00 GMT.

Meanwhile, panic selling sunk the total crypto market cap as low as $925 billion, marking a year-to-date loss of 58%. The dip was bought up to trigger an immediate spike to $1.041 trillion.
But further sell pressure has resulted in a protracted drawdown in the time since the spike. The current total market cap is hovering close to the previous local bottom, at $947 billion.
Weekend price action saw a gradual downtrend in Bitcoin. But Monday morning Asian trading triggered a rapid decline, falling from $28,000 to $22,600 at its lowest point.
Bitcoin sinks as inflationary fears rise
On Friday, the U.S Labour Department released May’s Consumer Price Index figure, showing an increase of 0.3% from the previous month, marking a 40-year high at 8.6%.
The news triggered an immediate sell-off in Bitcoin, and the wider crypto markets, as investors looked to adopt more defensive positions amid the likelihood of further quantitative tightening by the Fed.
Commenting on this, Alex Kuptsikevich, a Senior Market Analyst at FxPro, said the CPI figure puts more pressure on the Fed to accelerate its hawkish position.
“A renewal of inflation to 40-year highs will surely attract the public’s attention at the weekend and will pressure the Fed. Potentially, such high reading could trigger a tougher [Fed] stance in the accompanying commentary.”
All of which spells trouble ahead for Bitcoin and other risk-on correlated assets. But the question is, how low could BTC drop.
Technical analysis
Trader without_worries shared his analysis using a 2-week Bitcoin chart, saying the market bottom is “a lot closer than you think.”
Supporting his opinion is the imminent “2-week death cross,” scheduled to occur on June 20. At this point, the 21-week exponential moving average line will cross below the 50-week simple moving average.
He adds that previous instances of this happening have “called the market bottoms perfectly.”
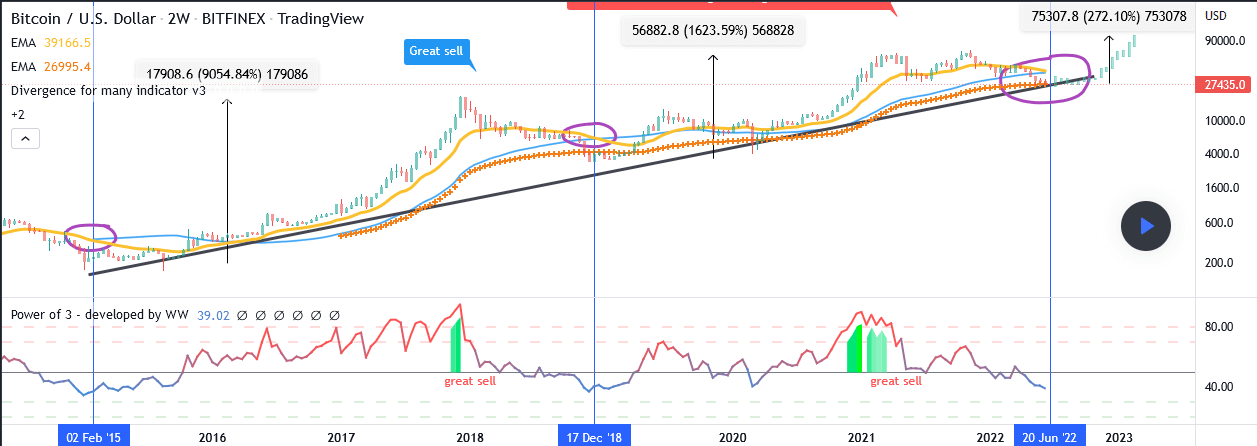

“what you have here is the 2-week death cross. That is the 2-week/21-week EMA (yellow line) crossing down the 2-week/50-week SMA (blue line). A death will print on June 20th.”
Meanwhile, Burning-Theta uses “a simple Fibonacci projection” to call a $12,200 bottom, which he expects to play out according to past major wave cycles.
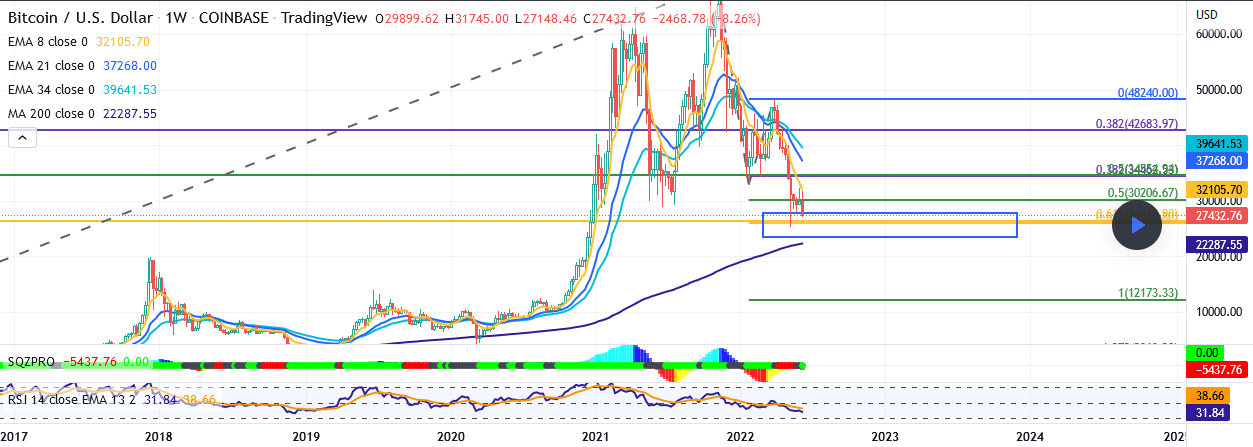

“When the first leg of the correction is projected from the peak of the bear rally high, a target of 12,173 is the point at which both major waves of the correction have equality / proportionality—a common, but not guaranteed, spot for a correction to end.”
It’s important to note that a common criticism of technical analysis is that it does not take into account the macroeconomic landscape.






Comments (No)