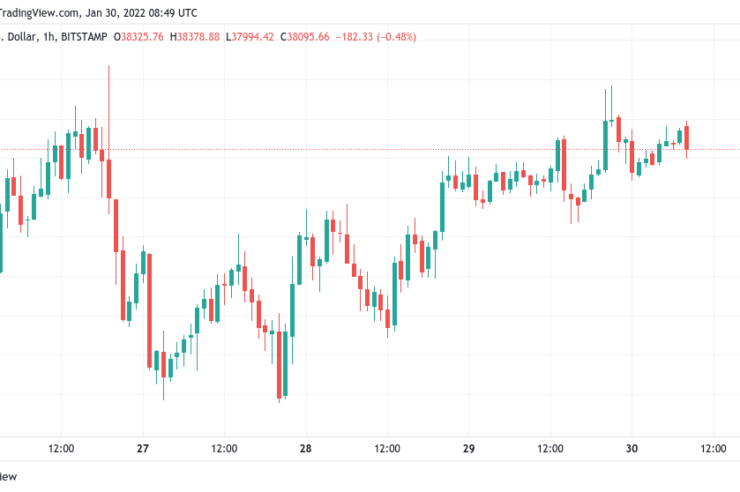
Bitcoin (BTC) circled the $38,000 mark into Jan. 30 as a “trappy” weekend still offered the chance of a solid weekly close.


“Choppy waters” for Bitcoin
Data from Cointelegraph Markets Pro and TradingView showed BTC/USD regaining the $38,000 mark after seeing local highs of $38,740 on Bitstamp the previous day.
Despite its strong “out of hours” performance, few analysts believed in BTC as a firm bullish play without traditional market guidance.
“Still choppy waters for Bitcoin,” Cointelegraph contributor Michaël van de Poppe summarized in his latest Twitter update.
“Looking at $37K to see whether that sustains. If not -> I’m assuming we’ll test lows for daily bullish divergence to create. If we hold, we might see a breaker above $38.5K happening. Weekend times -> boring/trappy.”
The highs nonetheless continued what looks like a slow return to form for BTC/USD on daily timeframes after its sub-$33,000 lows earlier in the week.
For trader, investor and entrepreneur Bob Loukas, strength lay in the pair’s multiple closes above the 10-day moving average (MA).
Two consecutive closes above the 10-dma for #bitcoin makes you think the lows are in now (for 60-day cycle). Maybe an attempt to get back down to $35k area is possible.
— Bob Loukas (@BobLoukas) January 29, 2022
Hopes of a weekly close at $39,600 resistance, however, still looked unlikely to be fulfilled at the time of writing.
“Crypto market is full of breakout traders. What is the easiest way to bait them on a weekend when morale is already low? Force a move,” the skeptical trader and analyst known as Cantering Clark on Twitter added.
RSI gives bulls cause for excitement
Shifting to on-chain data, meanwhile, popular analyst Matthew Hyland revealed yet more bullish cues coming from BTC’s relative strength indicator (RSI).
Related: No blow-off top? Bitcoin hodler metric points to ‘depressed’ BTC price
Across multiple chart timeframes, RSI recently hit its most “oversold” levels since the Coronavirus crash of March 2020.
The metric is used to determine how “overbought” or “oversold” BTC is at a particular price, and thus how likely a particular trend is to sustain.
Currently, thanks to the modest rebound off the lows, RSI appears to be in the process of challenging a multi-month downtrend in place since November.
“The two previous breakouts during the past year have lead to massive bullish moves,” Hyland added as part of Twitter comments alongside a chart showing the action.


Comments (No)