Solana (SOL) price may fall to $70 a token in the coming weeks as a head and shoulders setup emerged on the daily timeframe and possibly points toward a 45%+ decline.
The chart below shows that SOL price rallied to nearly $217 in September 2021, dropped to a support level near $134 and then moved to establish a new record high of $260 in November 2021. Earlier this week, the price fell back to test the same $134-support level before breaking to a 2022 low at $87.73.


This phase of price action appears to have formed a head and shoulders setup, a bearish reversal pattern containing three consecutive peaks, with the middle one around $257 (called the “head”) coming out to be higher than the other two around the $200 to $210 (left and right shoulders).
Meanwhile, SOL’s three peaks have stood atop a common support level at $134, called the “neckline.” A fall below it signals an extended downtrend to the level at length equal to the maximum distance between the head and the neckline.
In SOL’s case, the distance is around $137, which puts its head and shoulders price target at nearly $170.
The trend so far
The bearish outlook came as SOL price dropped by more than 22% this week and currently the altcoin is around 55% from its record high, much in line with other large-cap digital assets, including Bitcoin (BTC) and Ether (ETH).


At the center of the ongoing crypto market decline is the U.S. Federal Reserve’s decision to unwind its $120 billion a month asset purchasing program followed by three or more interest rate hikes spread throughout 2022.
The central bank’s loose monetary policies had assisted in pumping the crypto market’s valuation from $128 billion since March 2020 to as high as $3 trillion in Nov. 2021. Therefore, the evidence of tapering has been influencing investors to limit their exposure in over-pumped markets, including Solana, which had gained nearly 12,500% since March 2020.
As a result, if the crypto market continues declining in the sessions ahead, SOL will also be at risk of validating its head and shoulders setup.
SOL’s short term outlook
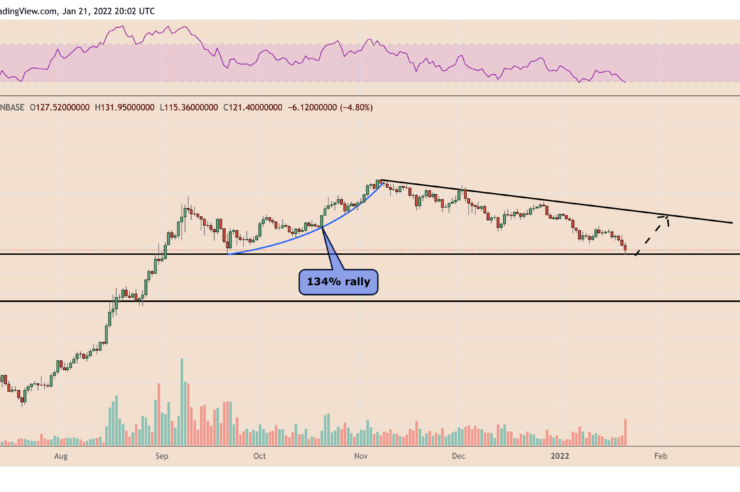
While SOL’s longer timeframe chart leans toward a prolonged bearish setup, its short-term outlook looks comparatively bullish.
Related: Bitcoin dumps to hit six-month lows near $38K


That is primarily due to two factors. First, SOL price has fallen to a critical support level of $116 that was instrumental in limiting its downside attempts in September 2021. And second, its daily relative strength index (RSI) dropped to below 30 — a classic buy signal.
The views and opinions expressed here are solely those of the author and do not necessarily reflect the views of Cointelegraph.com. Every investment and trading move involves risk, you should conduct your own research when making a decision.


Comments (No)