Bitcoin’s (BTC) weakness on Sep. 24 shows that the bears remain in control. Sellers are trying to pull the price below $26,000 but the bulls are likely to defend the level with vigor. Buyers are trying to achieve a positive monthly close for Bitcoin in September for the first time since 2016.
If they can pull it off, it will be a major sentiment booster as October generally favors the buyers. According to CoinGlass data, Bitcoin has seen a negative monthly close in October only on two occasions, in 2014 and 2018. However, Bitcoin bulls will find it difficult to maintain the momentum if macroeconomic headwinds persist.

Another risk to the cryptocurrency recovery may come from the strength in the greenback, which has risen for ten straight weeks, its longest winning streak since 2014. The United States dollar index (DXY) has also formed a golden cross, indicating further potential upside in the near term.
Will the U.S. dollar extend its gains or witness a short-term correction? Can Bitcoin bulls hold off the bear pressure in the last week of September? Let’s analyze the charts to find out.
S&P 500 Index price analysis
The S&P 500 Index turned down sharply from the downtrend line and broke below the moving averages on Sep. 15. This started a downward move, which has reached the crucial support at 4,325.

The 20-day exponential moving average (4,422) has started to turn down and the relative strength index (RSI) is near the oversold territory, indicating that bears have the edge. If the price maintains below 4,325, the index will complete a bearish head and shoulders (H&S) pattern. This negative setup has a target objective of 4,043.
If bulls want to prevent the fall, they will have to quickly drive the price above the 20-day EMA. That could attract further buying and the bulls will then attempt to kick the price above the downtrend line. If they manage to do that, the index has a good chance of retesting the local high at 4,607.
U.S. dollar index price analysis
The U.S. dollar index bounced off the 20-day EMA (104.85) on Sep. 20, indicating that the sentiment remains positive and traders are buying on dips.

The up-move is likely to hit a wall at 106. This is the key level to keep an eye on in the near term. If the price turns down from this resistance but bounces off the 20-day EMA, it will enhance the prospects of a rally above 106. The next resistance on the upside is at 108.
Sellers will have to yank the price back below the 20-day EMA if they want to weaken the bullish momentum. The index could then drop to 104.40 and later to the 50-day simple moving average (103.35).
Bitcoin price analysis
The uncertainty from the inside-day candlestick pattern on Sep. 22 and 23 resolved to the downside on Sep. 24. This suggests that the bears have asserted their supremacy.

The sellers will try to strengthen their position further by pulling the price to the solid support at $24,800. This remains the key level to watch out for in the near term as the bulls are expected to defend it with all their might. If the $24,800 support gives way, the BTC/USDT pair could start a downward move to $20,000.
Time is running out for the bulls. If they want to start a meaningful recovery, they will have to push and sustain the price above the moving averages. That will open the doors for a retest of the overhead resistance at $28,143.
Ether price analysis
Ether (ETH) has been gradually slipping toward the pivotal level at $1,531, suggesting a lack of buying support from the bulls.

Although the downsloping moving averages indicate advantage to sellers, the RSI is showing signs of forming a bullish divergence. This suggests that the selling pressure could be reducing. This increases the likelihood of a bounce off $1,531.
If bulls shove the price above the 20-day EMA ($1,616), it will signal a range-bound action between $1,531 and $1,746 for a few days. This view will invalidate if bears sink and sustain the ETH/USDT pair below $1,531. The pair could then plummet to $1,368.
BNB price analysis
BNB (BNB) has been swinging between $220 and $203 for the past few days. In a range, traders generally buy near the support and sell close to the resistance.

Both moving averages are sloping down, indicating advantage to bears but the RSI is trying to form a bullish divergence. This suggests that the bearish momentum may be weakening. Buyers are likely to defend the $203 level with vigor.
If the price rises from the current level or bounces off $203, it will suggest that the range-bound action may continue for some more time. Sellers will need to tug the price below the critical support at $203 to take charge. The BNB/USDT pair could then plunge to $183.
XRP price analysis
After staying above the 20-day EMA ($0.50) for a few days, XRP (XRP) tumbled below the level on Sep. 24. This suggests that the bears have gained the upper hand.

XRP price could fall to the uptrend line, which is expected to act as a strong support. If the price rebounds off the uptrend line, the bulls will again try to shove the price above the 20-day EMA. If they do that, it will signal aggressive buying at lower levels. The pair may then climb to the 50-day SMA ($0.53).
Contrarily, if the uptrend line fails to hold, XRP price could first slump to $0.46 and thereafter to the formidable support at $0.41. This level is likely to attract strong buying by the bulls.
Cardano price analysis
Cardano (ADA) dropped to the critical support at $0.24 on Sep. 25, indicating that the bears have maintained their pressure.

A minor advantage in favor of the bulls is that the RSI is forming a bullish divergence. The bulls will have to quickly shove the ADA/USDT pair above the downtrend line to reduce the risk of a breakdown below $0.24. If they can pull it off, the bearish descending triangle will be rendered invalid and that could boost the price to $0.29.
Instead, if bears drag ADA price below $0.24, it will complete the bearish setup. That could start a downward move toward $0.22 and subsequently to the pattern target of $0.19.
Related: How much is Bitcoin worth today?
Dogecoin price analysis
Dogecoin (DOGE) is stuck inside a tight range between $0.06 and the 20-day EMA ($0.06). Typically, a volatility squeeze is followed by an expansion in volatility but it is difficult to predict the direction of the breakout.

If the price turns up off the current level, the bulls will again try to clear the overhead hurdle at the 20-day EMA. If they succeed, the DOGE/USDT pair could rise to $0.07 and later sprint to $0.08. The bears are expected to sell near this level.
Alternatively, if the range resolves to the downside with a break below $0.06, it will indicate that bears have seized control. DOGE price may then nosedive to the next major support at $0.055.
Toncoin price analysis
Toncoin (TON) turned down sharply from the overhead resistance at $2.59 on Sep. 20 and continued lower, indicating that the bulls are booking profits.

The first support on the downside is at the 20-day EMA ($2.11). If the price rebounds off this level with strength, it will suggest that the sentiment remains positive and traders are buying on dips. The bulls will then again try to push the price to $2.59.
Contrary to this assumption, if the price skids below the 20-day EMA, it will indicate that the bulls are losing their grip. The TON/USDT pair could first dip to the psychological level of $2 and later to the 50-day SMA ($1.72). A deeper correction is likely to delay the next leg of the up-move.
Solana price analysis
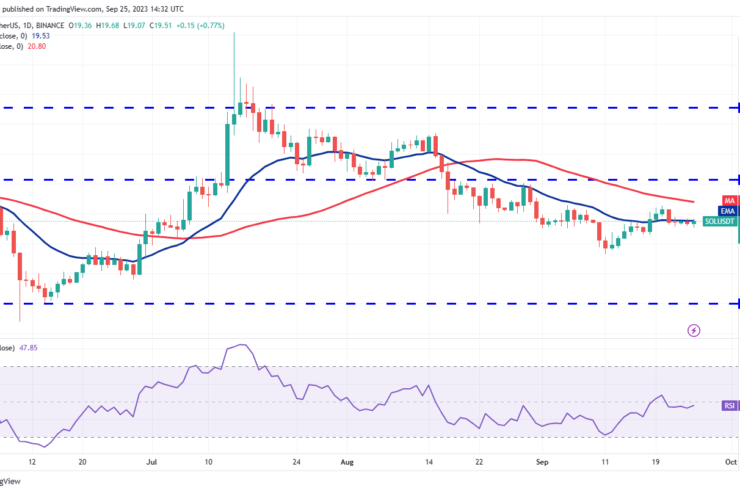
Solana (SOL) has been clinging to the 20-day EMA ($19.53) for the past few days, indicating a tough battle between the bulls and the bears.

The flattish 20-day EMA and the RSI just below the midpoint indicate a balance between supply and demand. On the upside, the bulls will have to thrust the price above the 50-day SMA ($20.80) to signal the start of a recovery to $22.30.
Conversely, if the price turns down from the current level, it will suggest that the bears are back in command. The SOL/USDT pair could then retest the important support at $17.33. If this level snaps, the pair may collapse to $14.
This article does not contain investment advice or recommendations. Every investment and trading move involves risk, and readers should conduct their own research when making a decision.


Comments (No)