After forming successive Doji candlestick patterns on the weekly chart for the past three weeks, Bitcoin (BTC) is on target to end the week on a positive note. This is an early sign that the uncertainty between the bulls and the bears is resolving to the upside.
Although the recovery is still in its early stages, the Federal Open Market Committee meeting on Sep. 20 could boost volatility. The majority of the market participants expect the Federal Reserve to maintain a status quo on rates but surprises could arise during Fed Chair Jerome Powell’s press conference following the rate decision.

Bitcoin’s recovery from the strong support near $24,800 has ignited buying interest in select altcoins, which are providing trading opportunities. For these altcoins to continue their upward trajectory, Bitcoin needs to maintain above $26,500.
Could Bitcoin’s relief rally pick up momentum, triggering buying in select altcoins? Let’s study the charts of top-5 cryptocurrencies that are showing promise in the near term.
Bitcoin price analysis
Bitcoin rose above the 20-day exponential moving average ($26,303) on Sep. 14, indicating that the selling pressure is reducing. Since then, the bulls thwarted several attempts by the bears to yank the price back below the 20-day EMA.

Buyers will try to build upon their advantage and drive the BTC/USDT pair to the 50-day simple moving average ($27,295). This level may act as a minor hurdle but if overcome, the pair is likely to reach $28,143. The bears are expected to defend this level with vigor.
If bears want to maintain the upper hand, they will have to sink the price below the 20-day EMA. That may trap the aggressive bulls and open the doors for a potential retest of the pivotal support at $24,800.

The price has been trading above the 20-EMA on the 4-hour chart indicating that the bulls are buying on dips. This suggests that the traders expect the recovery to continue. If buyers clear the hurdle at $26,900, the pair may climb to $27,600 and eventually to $28,143.
If bears want to make a comeback, they will have to sink and sustain the price below the 20-EMA. Such a move will clear the path for a further fall to the 50-SMA and later to the strong support zone between $25,600 and $25,300.
Maker price analysis
Buyers propelled Maker (MKR) above the 50-day SMA ($1,162) on Sep. 15, indicating that the bulls are attempting to take charge.

The MKR/USDT pair is on its way to $1,370. This level is likely to witness a tough battle between the bulls and the bears. If the bulls do not give up much ground from this level, the likelihood of a break above it increases. If that happens, the pair could pick up momentum and dash toward $1,759.
The crucial level to watch on the downside is the 20-day EMA ($1,162). If this level cracks, it will suggest that the pair may swing inside the large range between $980 and $1,370 for some time.

The 4-hour chart shows that the bulls remain in command but the RSI near the overbought territory suggests a minor correction or consolidation in the near term. The 20-EMA remains the key level to watch on the downside. A break and close below it could indicate the start of a deeper correction toward the 50-SMA.
Instead, if the price bounces off the 20-EMA, it will be a sign that the bulls continue to buy the dips. That may start a rally toward the stiff overhead resistance at $1,370.
Aave price analysis
Aave (AAVE) surged above the moving averages on Sep. 16, indicating that the bulls have made their move. However, the long wick on the day’s candlestick shows selling at higher levels.

A minor advantage in favor of the bulls is that they did not allow the bears to make a comeback and are again trying to sustain the price above the 50-day SMA ($59). If they succeed, the AAVE/USDT pair is likely to accelerate toward $70 and later to $76.
The 20-day EMA ($56) is the important support to keep an eye on in the near term. If the price skids below this level, it will suggest that bears are active at higher levels. That could sink the pair to the solid support at $48.

The 4-hour chart shows that the bulls recently purchased the pullback to the 20-EMA, indicating that the sentiment has turned positive. Buyers will try to propel the price above the resistance at $63. If they can pull it off, the pair could soar to $70.
Contrary to this assumption, if the price turns down and breaks below the 20-EMA, it will suggest that demand dries up at higher levels. The pair could then slide to the 50-SMA which may attract buyers.
Related: How low can the Bitcoin price go?
THORChain price analysis
THORChain (RUNE) has staged a smart recovery in the past few days, indicating that the buyers are attempting a comeback.

The up-move is nearing the solid resistance at $2, which is likely to act as a major roadblock. If the price turns down sharply from $2, it will indicate that the bulls are rushing to the exit. That could tug the price down to the 20-day EMA ($1.62).
Contrarily, if the RUNE/USDT pair does not give up much ground from the current level, it will suggest that the bulls are holding on to their positions as they anticipate the rally to extend further. If $2 is taken out, the pair could start a new uptrend to $2.30 and subsequently to $2.80.

The 4-hour chart shows that the $2 level is acting as a resistance. The price may pull back to the 20-EMA, which is likely to act as a strong support. If the price rebounds off this level with strength, the bulls will again attempt to overcome the obstacle at $2. If they manage to do that, the pair may soar toward $2.30.
The first sign of weakness will be a break and close below the 20-EMA. That could tempt several short-term traders to book profits. The pair may then slump to the 50-SMA.
Render price analysis
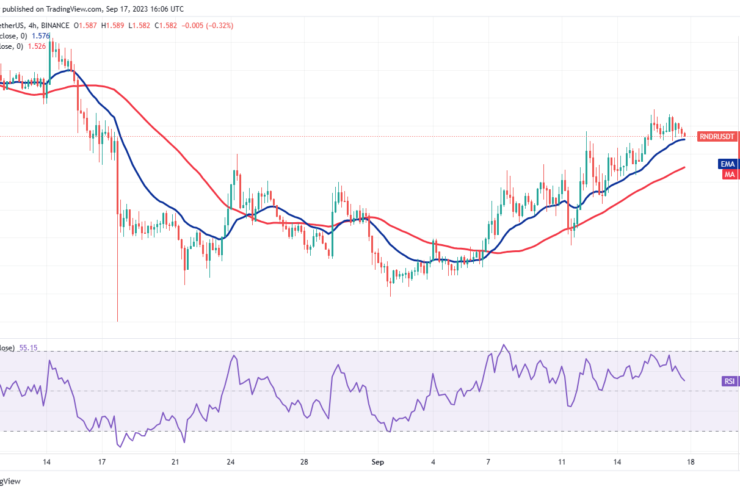
Render (RNDR) broke out and closed above the 50-day SMA ($1.58) on Sep. 15, indicating that the selling pressure could be reducing.

The moving averages are on the verge of a bullish crossover and the RSI is in the positive territory indicating that bulls have a slight edge. If the price turns up from the 20-day EMA ($1.50), it will suggest a change in sentiment from selling on rallies to buying on dips. That could start a stronger recovery to $1.83 and then to $2.20.
This positive view could invalidate in the near term if the price continues lower and breaks below the moving averages. The RNDR/USDT pair could then plummet to $1.38 and later to $1.29.

The moving averages on the 4-hour chart are sloping up and the RSI is in the positive territory, indicating advantage to buyers. The first support to watch on the downside is the 20-EMA. If the price turns up from this level, it will signal that bulls continue to view the dips as a buying opportunity. That increases the possibility of a rally to $1.77.
On the contrary, if the 20-EMA gives way, the pair could slide to the 50-SMA. This is an important level for the bulls to defend because a break below it may sink the pair to $1.39.
This article does not contain investment advice or recommendations. Every investment and trading move involves risk, and readers should conduct their own research when making a decision.


Comments (No)