The price of Bitcoin (BTC) is fluctuating inside a narrow trading range for several days, and Aug. 2 is no different.
Why is Bitcoin price stuck?
Bitcoinprice fell nearly 1% to around $29,500 on the day. Still, the move downside was part of a flat market trend that started a week ago, wherein the price has traded inside the $28,850-29,660 range.

The sideways trend follows Bitcoin’s 4% drop below $30,000 last week, primarily due to the Federal Reserve’s interest rate hike. Rate increases have historically been bearish for non-yielding cryptocurrencies like Bitcoin.
Nonetheless, Wall Street economists anticipate a rate hike pause in the next Fed meeting in September, which may be limited Bitcoin’s downside below $29,000.
On the flip side, the BTC struggles to stay above $30,000 — a psychological resistance level — due to broader market risks. That includes regulatory uncertainty around Binance — the world’s largest crypto exchange by volume — and a recent Defi exploit costing $47 million.
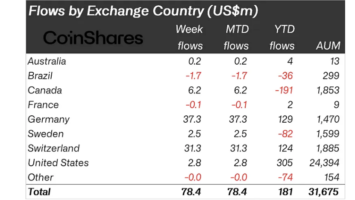
The ongoing bias conflict in the Bitcoin market has coincided with depleting institutional interest. According to CoinShares’ weekly report, investors withdrew about $19.4 million from Bitcoin-based investment funds in the week ending July 28.

“93% of the outflows were from long-Bitcoin investment products, while short-Bitcoin saw its 14th consecutive week of outflows totaling $3.1 million,” wrote James Butterfill, investment strategist at CoinShares, adding:
“This suggests investors have been taking profits in recent weeks, with the sentiment for the asset overall remaining supportive.”
Bitcoin price outlook for August
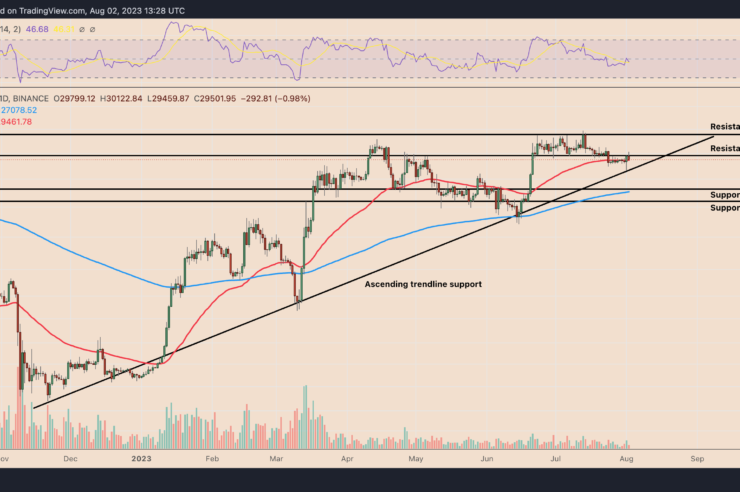
From a technical standpoint, Bitcoin currently holds above its 50-day exponential moving average (50-day EMA; the red wave) while eyeing a close above $30,000, its immediate resistance level.
Related: ETF analyst raises spot Bitcoin ETF approval chances in the US to 65%
If the price breaks above the $30,000, then BTC’s likelihood of rallying toward $31,500, a local peak level, is high for the month of August.

The upside target seems valid as long as BTC price trades above its multi-month ascending trendline support. Nonetheless, breaking decisively below the 50-day EMA and the ascending trendline risks crashing Bitcoin toward its 200-day EMA (the blue wave) near $27,000.
This level served as support during the March-April session earlier this year,
This article does not contain investment advice or recommendations. Every investment and trading move involves risk, and readers should conduct their own research when making a decision.


Comments (No)