Bitcoin (BTC) headed lower on Aug. 12 as a broadly expected comedown from two-month highs began to take shape.


200-week moving average becomes pivot
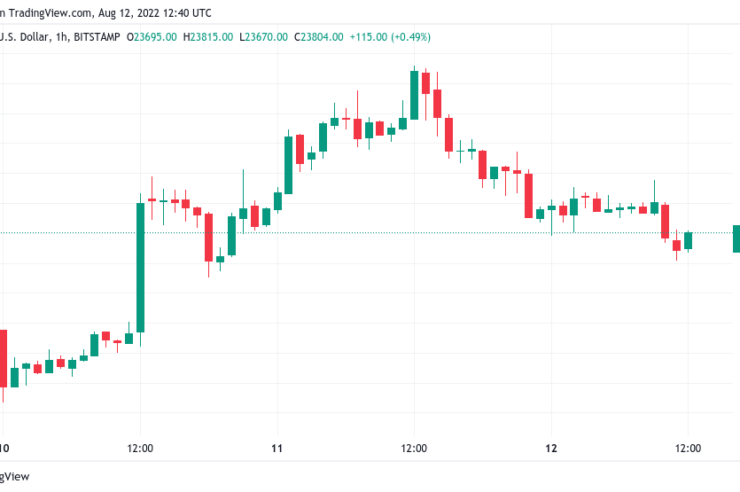
Data from Cointelegraph Markets Pro and TradingView showed BTC/USD dipping to $23,615 on Bitstamp prior to the day’s Wall Street open, marking 24-hour losses of around 5.2%.
The pair had seen its highest levels since June 13 as enthusiasm over declining United States inflation combined with news that the world’s largest asset manager, BlackRock, was launching a Bitcoin private fund.
While some commentators hoped for Bitcoin to tackle resistance closer to $30,000 as a result, others remained cautious, with suspicions that a fresh downtrend could ensue remaining.
Target 1 hit https://t.co/iBA8qRrEOq
— Crypto Tony (@CryptoTony__) August 12, 2022
“Volume is dying. Channels are not impulses but corrections,” popular trading account Il Capo of Crypto wrote in its latest update on the day.
“Most people expecting 28k or higher, but the big level is 25000-25500.”
A further post reinforced the idea that the recent gains were part of a “bear market rally.”
Fellow trader Jibon meanwhile drew fresh attention to Bitcoin’s 200-week moving average (MA), currently near $23,000.
After reclaiming it during the run-up, the important bear market support level was now fast approaching as spot price weakened.
“If 200 MA Reject, Ready for Some Drop,” he warned in part of a fresh post on the day.
Ethereum remains “very strong”
Striking a more positive tone, meanwhile, Crypto Ed stuck by predictions of further gains for both Bitcoin and largest altcoin Ethereum (ETH).
Related: Coming sooner: ETH devs move up the date for Merge
Having called the trip to $1,900 for ETH/USD, a breakout to $29,000 was still on the cards for BTC/USD, he said on the day.
Same move in #BTC would mean 28-29k
But that shouldn’t surprise you when following me. Already calling that for weeks in my YT updates. https://t.co/Y1lPwNAPKx pic.twitter.com/4Q5UmNqOGy— Ed_NL (@Crypto_Ed_NL) August 12, 2022
In an accompanying YouTube update, Crypto Ed added that should a retracement enter next, a suitable long position for BTC would be $23,400.
“Is there anything bearish for me? I think only if we go below $22,000 and we have a bearish retest of that level,” he continued.
Regarding Ethereum, fellow trader TechDev described price action as “very strong,” noting that ETH/USD had reclaimed its 20-week exponential moving average while BTC/USD was “still fighting” the 10-week equivalent.


The views and opinions expressed here are solely those of the author and do not necessarily reflect the views of Cointelegraph.com. Every investment and trading move involves risk, you should conduct your own research when making a decision.


Comments (No)