The Times reported that the US had entered a technical recession as GDP shrank 0.9% annually after the second-quarter report was released Thursday.
The chart below shows the real GDP of the US compared with the price of Bitcoin since 2017. It can be seen that when GDP declines, the price of Bitcoin trends upwards.
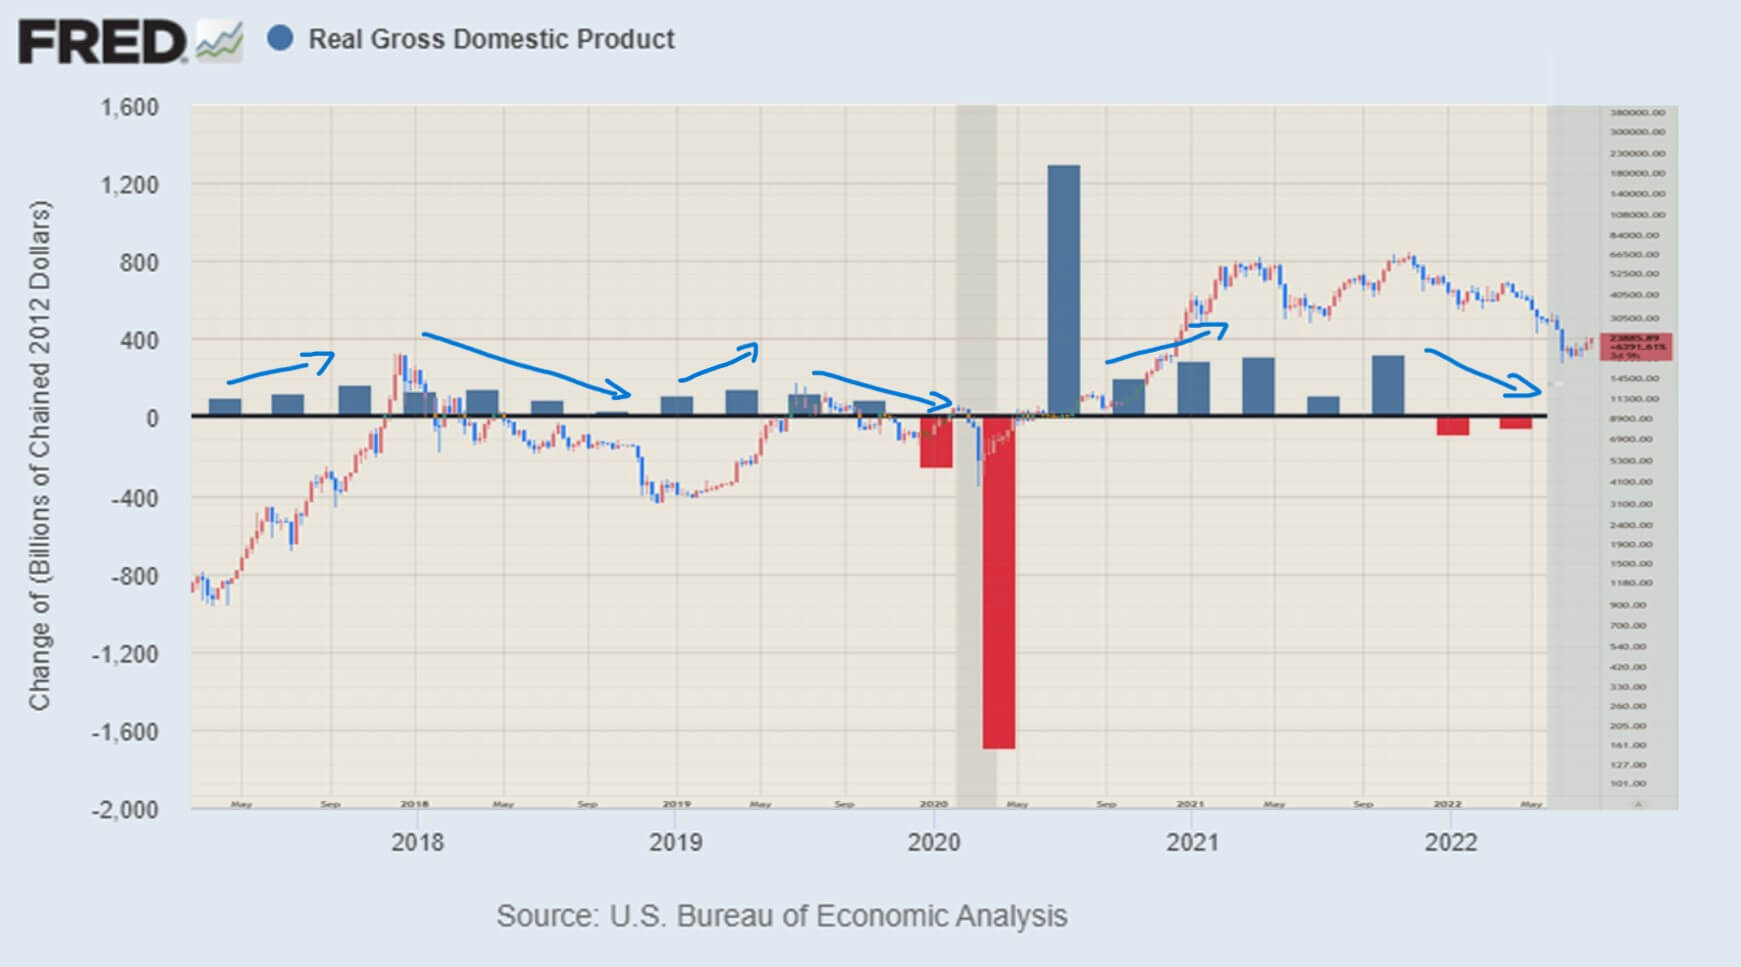

However, it is essential to remember that correlation is not de facto causation. Just because Bitcoin has been in a bullish trend while GDP has been increasing and vice versa does not mean one caused the other. Yet, the comparison clearly shows that in a prosperous economy, Bitcoin can thrive.
The recently released data showcases the most significant warning signs of a recession on the horizon and may make a new bull run more difficult.
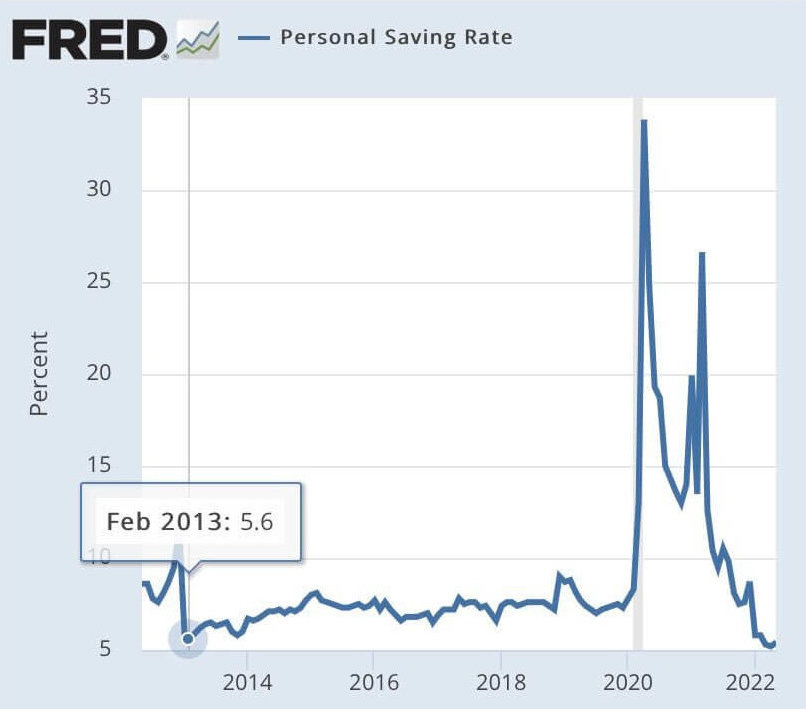
Further, personal savings among US citizens hit a 10-year low, indicating that the money from stimulus checks no longer supports the economy. With savings at just 5.4%, it means that increases in interest rates are likely to have little benefit to smaller investors. However, the expansion will affect credit card payments, mortgages, and other loans held by US citizens.

While savings have decreased, consumer loans have risen, reaching an all-time high since FRED records began in 2000. There is over $850 billion worth of consumer loans outstanding to US citizens when interest rates are up 900% per year.
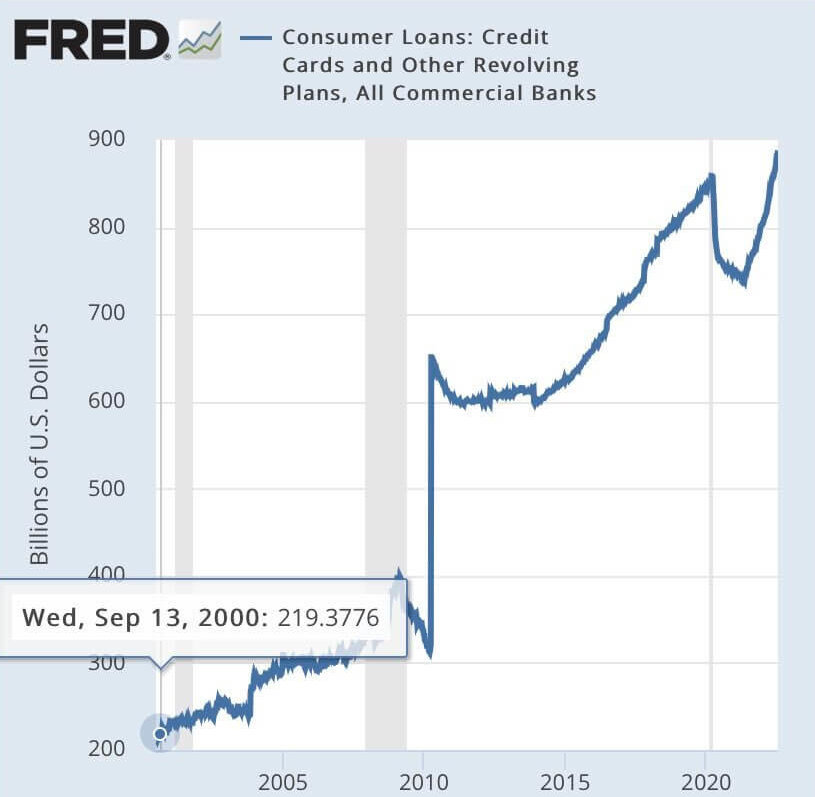

At the start of 2022, interest rates were 0.25%, with $804 billion worth of loans outstanding, making annual interest around $2 billion. As of July 2022, 6 months later, the interest rate is 2.5%, with $887 billion of loans outstanding. The resulting interest payments come to $22 billion, an increase of 1,000%.
During this same period, the price of Bitcoin has declined 48%, reducing the market cap by $417 billion. By comparison, US consumers’ total debt is now almost double the market cap of Bitcoin, with annual interest payments amounting to around 5% of Bitcoin’s total value.
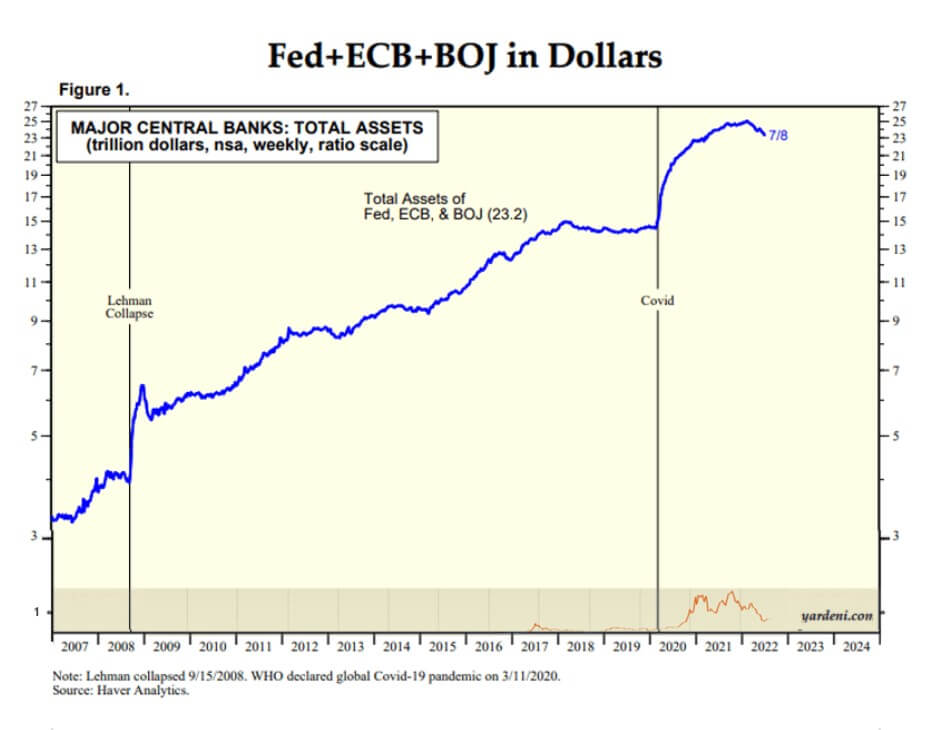
Quantitative Easing has been in place since the global economic crash of 2008.
Assets held by the Federal Reserve, European Central Bank, and the Bank of Japan have declined for the first time since 2018 and the most extended period since 2012. The major central banks currently hold $9 trillion more than they did at the start of 2020. To put this into perspective, the Bitcoin chart since 2009 is shown in orange at the bottom on the same scale, with its peak market cap reaching just $1.3 trillion.

Bitcoin is up 15% since the local low on June 26. At the time of writing, it is trading at $23,891, rising 5% since the GDP data was released earlier this afternoon. Could this be a flight to safety of a non-fiat-based asset class or merely a bear trap to entice investors?
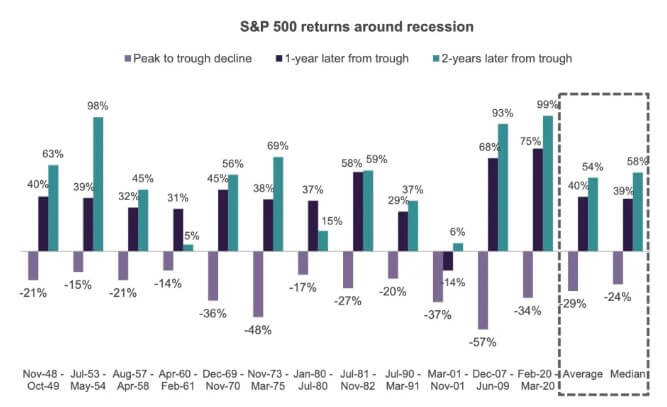
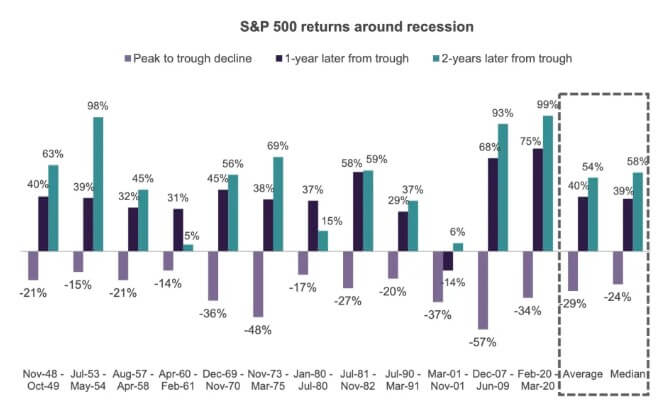
Several macro factors indicate a bearish future for the US economy; however, traditionally, markets bottom out before the end of the recession. The below chart from Yahoo! Finance highlights the 1-year and 2-year returns following a recession. The average return 1-year after the start of a recession is 40% on the S&P 500.
Bitcoin has never existed through a recession (not counting the start of the pandemic), so it will be interesting to see if it can outperform the S&P over the next twelve months. An increase of 40% from today’s price would put Bitcoin at $33,600 this time next year.

FRED data and insights by James van Straten







Comments (No)