The cryptocurrency market has experienced another rollercoaster week that saw Ether price drop below $3,000 and Bitcoin price hit a new multi-month low at $37,700. Equities markets also endured a sharp sell-off primarily due to investor fear over potential changes to the size of the Federal Reserve’s next rate hike.
To date, Bitcoin price 41.72% down from its $69,000 all-time high and while price might be in what some describe to be a bear market, a deeper dive into various on-chain and derivatives data shows that a drop in inflows and pivot from institutional investors are the main factors impacting BTC price action.
Perpetual futures dominate trade volumes
A lot has changed in the crypto market since 2017 when the Bitcoin market was dominated by spot trading and derivatives markets made up just a small fraction of trading volume.
According to a recent report from on-chain market intelligence firm Glassnode, Bitcoin derivatives “now represent the dominant venue for price discovery” with “future trade volume now representing multiples of spot market volume.”
This has important implications for the current price action for BTC because futures trade volume has been declining since January 2021. The metric is down more than 59% from a high of $80 billion per day during the first half of 2021 to its current volume of $30.7 billion per day.


During that same time period, perpetual futures have overtaken traditional calendar futures as the preferred instrument for trading because they more closely match the spot index price and the costs associated with taking delivery of BTC is considerably lower than traditional commodities.
According to Glassnode, “the current open interest in perpetual swaps is equivalent to 1.3% of the Bitcoin market cap, which is approaching historically high levels.”
Despite this, the total transfer of capital and leverage out of calendar expiring futures has led to a declining leverage ratio, which “suggests that a reasonable volume of capital is actually leaving the Bitcoin market.”
The cause for this capital rotation is likely related to the fact that the yields available in futures markets are currently just above 3.0%, which is only 0.1% higher than the 2.9% yield available on the 10-year U.S. Treasury Bond and well below the 8.5% U.S. CPI inflation print.


Glassnode said,
“It is likely that declining trade volumes and lower aggregate open interest is a symptom of capital flowing out of Bitcoin derivatives, and towards higher yield, and potentially lower perceived risk opportunities.”
Related: Trader flags BTC price levels to watch as Bitcoin still risks $30K ‘ultimate bottom’
On-chain data points to large entity adoption
Moving away from derivatives markets, positive signs for the future of Bitcoin can be found by digging deeper into on-chain volume data.
Beginning in October 2020, the percentage of transactions greater than $10 million has increased from 10% of transfer volume on a good day, to an average daily dominance of 40% currently.
According to Glassnode, this points to significant growth “in value settlement by institutional sized investment/trading entities, custodians, and high net worth individuals.”


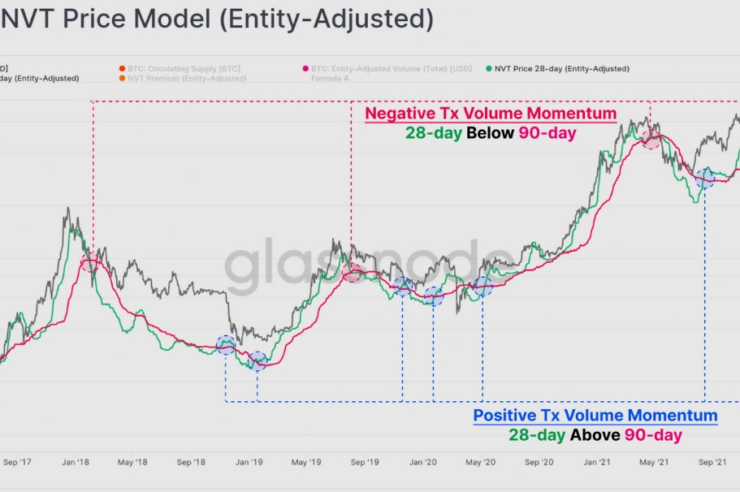
Using aggregate transaction volumes in conjunction with the Network Value to Transactions (NVT) Ratio, the current value of Bitcoin is between $32,500 and $36,100.


According to Glassnode, both the 28-day and 90-day NVT models are “starting to bottom out and potentially reverse” with the 28-day breaking above the 90-day, which has historically “been a constructive medium to long-term signal.”
The overall cryptocurrency market cap now stands at $1.791 trillion and Bitcoin’s dominance rate is 41.5%.
The views and opinions expressed here are solely those of the author and do not necessarily reflect the views of Cointelegraph.com. Every investment and trading move involves risk, you should conduct your own research when making a decision.


Comments (No)