Bitcoin (BTC) has been stuck between $45,400 and $47,500 for the past two days, indicating a tough tussle between the buyers and sellers as both attempt to establish control over the trend.
Data from on-chain analytics firm Glassnode showed that 100,000 Bitcoin left exchanges in March. These large quantities of withdrawals have only happened twice in the history of Bitcoin with the largest being in March 2020. However, this does not mean the price will rally immediately. In 2020, the momentum picked up only by the fourth quarter of the year.
For the near term, analysts remain divided with some expecting Bitcoin to drop to $44,800 or even to $43,000 while others anticipate a rally to the psychological level at $50,000.


As the crypto markets mature, they continue to attract new investors. A report by Gemini crypto exchange highlighted that the number of users who purchased their first cryptocurrency in 2021 soared by more than 50% in India, Brazil and Hong Kong. Even Latin America, Asia Pacific, the United States and Europe witnessed over 40% more new users who started investing in 2021.
Could Bitcoin and altcoins bounce off their support and extend the recovery? Let’s study the charts of the top-10 cryptocurrencies to find out.
BTC/USDT
The long wick on the candlestick of the past two days suggests that bears are selling near the 200-day simple moving average (SMA) ($48,266). A minor positive has been that the bulls have not allowed Bitcoin to break below the important support at $45,400.


However, this tight-range trading is unlikely to continue for long. If the price breaks below the 20-day exponential moving average (EMA) ($44,467), the BTC/USDT pair could drop to the 50-day SMA ($41,689). Such a move could invalidate the short-term bullish setup.
Conversely, if the price rises from the current level or the 20-day EMA, it will suggest that traders continue to buy on dips. That could enhance the prospects of a break above the 200-day SMA. If that happens, the pair could rally to $52,000.
ETH/USDT
Ether (ETH) broke and closed above the 200-day SMA ($3,487) on April 3 but the bulls could not sustain the higher levels. This suggests that the bears are trying to pull the price lower and trap the aggressive bulls.


If the price breaks below $3,411, the bears will try to pull the ETH/USDT pair to the 20-day EMA ($3,197). This is an important level for the bulls to defend if they want the positive momentum to remain intact.
If the price rebounds off the 20-day EMA, the buyers will again try to thrust and sustain the price above the 200-day SMA. If they manage to do that, the pair could rally to $4,000.
On the other hand, if the 20-day EMA support gives way, the selling could intensify and the pair may drop to the 50-day SMA ($2,895).
BNB/USDT
BNB has been trading close to the $445 level for the past few days. Although the bulls pushed the price above this level repeatedly, they could not sustain the higher levels and challenge the 200-day SMA ($467). This indicates that demand dries up at higher levels.


The bears will now try to pull the price to the 20-day EMA ($421), which is an important support to watch out for. If the price rebounds off this level, the buyers will make one more attempt to clear the overhead hurdle and push the BNB/USDT pair to $500.
Alternatively, if the price breaks below the 20-day EMA, it will suggest that the short-term traders may be booking profits. That could pull the price to the 50-day SMA. A break below this support will suggest that the break above $445 may have been a bull trap.
SOL/USDT
Solana’s (SOL) recovery stalled just below the 200-day SMA ($150). This suggests that higher levels are attracting selling by the bears. The bears will now try to pull the price to the breakout level at $122.


If the price rebounds off $122, the bulls will make another attempt to clear the overhead hurdle at the 200-day SMA. If they succeed, the SOL/USDT pair could rally toward the psychological level at $200. The rising 20-day EMA ($111) and the relative strength index (RSI) near the overbought zone indicate advantage to buyers.
Contrary to this assumption, if bears sink the price below $122, the pair could drop to the 20-day EMA. This is an important support to keep an eye on because a break below it could result in a decline to the 50-day SMA ($96).
XRP/USDT
The bulls attempted to push Ripple (XRP) above the overhead resistance at $0.86 but the bears did not budge. The failure to rise above $0.86 may attract profit-booking from short-term traders, which could sink the price to the 50-day SMA ($0.78).


If the price once again bounces off the 50-day SMA, it will suggest that bulls are accumulating on dips. That could keep the XRP/USDT pair stuck between the 50-day SMA and the 200-day SMA ($0.89) for a few days.
The flattish 20-day EMA ($0.82) and the RSI near the midpoint also suggest a consolidation in the near term.
If bears pull the price below the 50-day SMA, the pair could plummet to $0.70. Alternatively, if buyers drive the price above the 200-day SMA, the pair could rally to the psychological level at $1.
ADA/USDT
Cardano (ADA) turned up on April 1 and has reached the overhead resistance at $1.26 where the bulls are likely to encounter strong resistance from the bears.


The upsloping 20-day EMA ($1.08) and the RSI near the overbought zone indicate that the path of least resistance is to the upside. If bulls push the price above $1.26, the ADA/USDT pair could rally to the 200-day SMA ($1.48) and then to $1.63.
Conversely, if the price once again turns down from the overhead resistance, the pair could drop to the 20-day EMA. A break and close below this support could pull the price down to the psychological level at $1.
LUNA/USDT
Terra’s LUNA token broke out of the overhead resistance at $111 on April 2 and made a new all-time high at $118 on April 3. This suggests that the bulls are in the driver’s seat.


However, the negative divergence on the RSI warns that the bullish momentum may be weakening and the LUNA/USDT pair could witness a minor correction or consolidation.
If the price slips below the 20-day EMA ($100), traders who may have bought at lower levels could book profits. That could pull the price down to the 50-day SMA ($84).
Conversely, if the price rebounds off the 20-day EMA, it will suggest that the bulls continue to defend the level aggressively. The buyers will then try to push the pair above $118. If they succeed, the pair could rise to $125 and later march toward $150.
Related: Neutrino Dollar breaks peg, falls to $0.82 amid WAVES price ‘manipulation’ accusations
AVAX/USDT
Avalanche (AVAX) repeatedly broke above the overhead resistance at $98 in the past few days but the bulls could not sustain the higher levels. This indicates that bears are defending the level with vigor.


The bears will now try to pull the price to the 20-day EMA ($89). This is an important level to watch out for because a strong rebound off it will suggest that the sentiment remains bullish and traders are buying on dips.
That could increase the possibility of a break and close above the $98 to $100 resistance zone. If that happens, the AVAX/USDT pair could rally to $120.
Contrary to this assumption, if the price continues lower and breaks below the 20-day EMA, the next stop could be the 50-day SMA ($82). The pair could then extend its range-bound action for a few more days.
DOT/USDT
Polkadot (DOT) broke and closed above the overhead resistance at $23 on April 3 but the bulls could not sustain the higher levels. This suggests that the bears have not yet given up and are selling on every rise.


The bears are trying to sustain the price below $23 and trap the aggressive bulls who may have gone long on a breakout above the resistance. The critical level to watch on the downside is the 20-day EMA ($21).
If this support cracks, the DOT/USDT pair could drop to $19. If the price rebounds off this level, the DOT/USDT pair could remain range-bound between $19 and $23 for a few days.
Conversely, if the price turns up from the current level and breaks above $24, the pair could rally to the 200-day SMA ($29).
DOGE/USDT
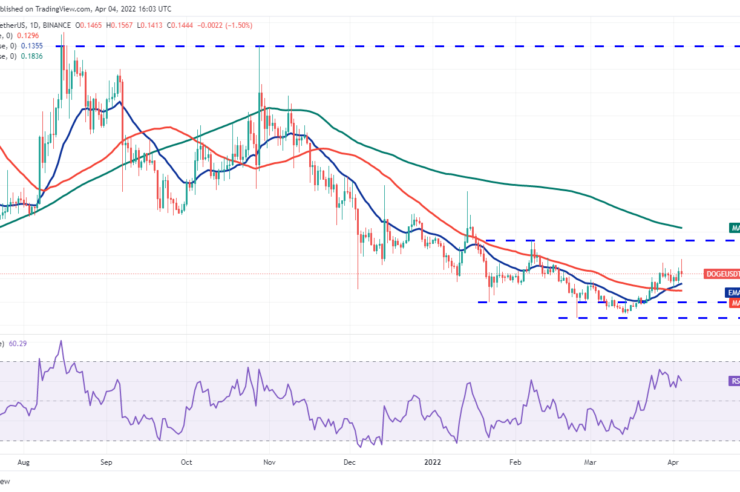
Dogecoin (DOGE) rebounded off the 20-day EMA ($0.13) on April 3, indicating that the bulls continue to defend this level aggressively. The rising 20-day EMA and the RSI in the positive zone indicate an advantage to buyers.


The buying continued on April 4 and the bulls attempted to resume the up-move toward the overhead resistance zone between $0.17 and the 200-day SMA ($0.18) but the long wick on the candlestick suggests that bears are selling at higher levels.
If the price continues lower and breaks below the 20-day EMA, it will suggest that the DOGE/USDT pair could remain range-bound between $0.10 and $0.17 for a few more days.
The bulls will have to propel and sustain the price above the 200-day SMA to signal a potential change in trend.
The views and opinions expressed here are solely those of the author and do not necessarily reflect the views of Cointelegraph. Every investment and trading move involves risk. You should conduct your own research when making a decision.
Market data is provided by HitBTC exchange.


Comments (No)