Bitcoin (BTC) gave back $2,500 of its newly-won gains during Feb. 8 as a long-awaited correction took center stage.


Hopes $42,000 will be preserved
Data from Cointelegraph Markets Pro and TradingView followed BTC/USD as it neared $43,000 after previously hitting new multi-week highs of $45,500.
At the Wall Street open, ranging continued as bulls eyed levels for potential support in the event of further losses.
Previously, these had included both $40,000 and $41,000, along with several zones in the upper $30,000-$40,000 corridor.
For popular Twitter trader Muro, however, $42,000 needed to gain significance as an intermediate floor to flip sentiment bullish.
“Either we get not significant pullback and go to 51 next,” he summarized on the day.
“Or I wouldn’t be surprised if this retraces fully back. Leaning slightly bullish as long as 42 holds.”
An accompanying chart underscored that falling back to the area around $38,000 would likely be an attractive buy-in for investors, but that this in itself would not be conducive to further market strength.


Cointelegraph contributor Michaël van de Poppe meanwhile said that Bitcoin was facing “crucial” resistance.
“In that regard, I’m assuming we won’t break in one go and have a correction -> ending up bad for altcoins,” he warned Twitter followers.
At the time of writing, $43,000 was seeing repeated retests as Wall Street trading failed to spur fresh upside.
400 days of consolidation and counting
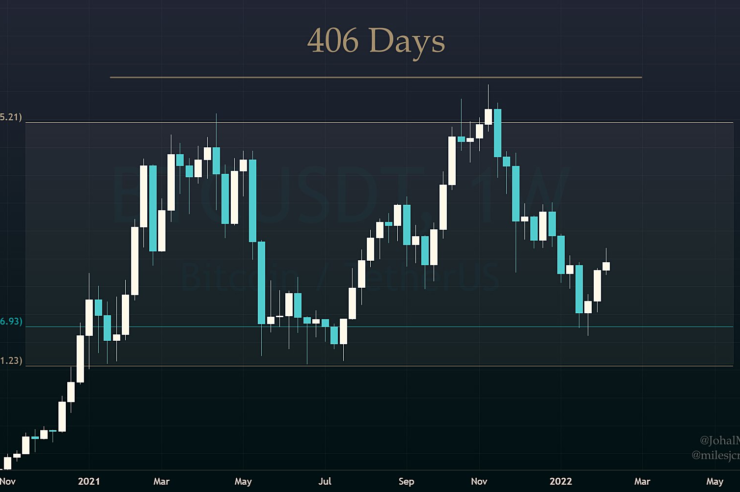
In classic style, those zooming out were calmer, chalking up current price action to part of a consolidation phase now in place for more than 400 days.
Related: BTC price returns to $43K — 5 things to watch in Bitcoin this week
“In my opinion Bitcoin has been in a bull market and consolidating sideways for more than 1 year. There have been no bear markets imo, it is all consolidation as you can clearly see below,” market commentator Miles Johal wrote alongside a chart showing the structure.
“When the range breaks, the next move will be massive. This is Bitcoin after all.”


Comments (No)